Competition is exceedingly high within the pharmaceutical and biotechnology industry whereby quality standards are thus reprehended. This requires constant supervision and investigation of processes involved in the production processes to ensure that products meet the necessary specifications and regulatory requirement. By leveraging Process Capability analysis, APQR empowers organizations to refine their processes, ultimately amplifying the efficacy and quality of their products.
Process Capability

- Cp (Capability Index): This measures the potential capability of a process by comparing the width of the process distribution to the width of the specification limits. It is calculated as:

Where:
USL represents the Upper Specification Limit, LSL represents the Lower Specification Limit, and σ (sigma) is the standard deviation of the process.
- Cp values fall between 0 and 1.
- When Cp ≥ 1, it means the process spread matches the specification spread. Higher Cp values suggest the process is better at making products within set limits.
- Generally, a Cp value of 1.33 or greater is seen as good for most processes, showing a strong capability level.

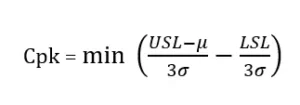
Where:
μ (mu) is the process mean, and σ (sigma) is the standard deviation of the process.
- Cpk values also fall between 0 and 1.
- When Cpk ≥ 1 or higher signal that the process is better aligned within the specification limits and can reliably meet the specifications.
- Cpk ≥33 or above indicates a strong process capability.
- Quality Assessment: Cp and Cpk values provide quantitative measures of process capability. Higher Cp and Cpk values signify that the process reliably produces products within predetermined limits consistently. This information helps in evaluating the quality of the manufacturing process.
- Continuous Improvement:By regularly monitoring process capability indices, organizations can identify areas for improvement and implement corrective actions to reduce variability and enhance process performance. By assessing the variation in the process, both within and between batches determines the stability and predictability of the process. In addition, monitoring Cp and Cpk values over time enables organizations to optimize their operations to achieve desired levels of capability.
- Regulatory Compliance: In regulated industries like pharmaceuticals, demonstrating process capability is crucial for complying with quality standards and regulatory requirements. Regulatory agencies frequently mandate that pharmaceutical firms showcase process capability as part of their quality assurance and compliance regulations.
Annual Product Quality Review (APQR)
The Annual Product Quality Review (APQR) is a comprehensive evaluation process encompassing all batches of a product manufactured over the preceding year. The review is mandated by regulatory authorities within the pharmaceutical industry to ensure consistent quality, thereby facilitating proactive measures to maintain high standards.
Key Components
- Quality Data Review: Involves a thorough analysis of quality data, including test results, batch records, deviations, and specification outcomes. This helps outlines any modifications made to the manufacturing process during the reporting period, along with deviations from standard procedures and their impact on product quality. Moreover, Batch Manufacturing Records (BMR) provide details about the manufacturing process, like batch numbers, quantities produced, equipment used, and any deviations encountered during production.
- Process Performance:The review assesses the performance of manufacturing processes, including critical process parameters (CPP) along with specification limits. This ensures that processes remain in a state of control.
- Compliance Review: APQR ensures compliance with Good Manufacturing Practices (GMP) regulatory requirement. It demonstrates a commitment to maintaining high-quality standards by incorporating essential GMP elements such as thorough audit trail viewing, robust access authentication, and meticulous history tracking. These features guarantee transparency and accountability in manufacturing processes, thereby strengthening the integrity of quality assurance practices.
- Statistical Analysis: APQR typically involves examining trends over time to detect patterns or recurring issues regarding product quality or manufacturing processes. This helps in quick identification of OOT by tracking LSL and USL values. APQR automates descriptive analysis and is capable to capture control charts and process capability charts to ensure rigorous quality control and process optimization.
Implementing Process Capability Analysis in APQR: Enhancing Quality Evaluation and Performance Assessment
While Process Capability primarily focuses on the current performance of manufacturing processes, APQR takes a broader view, encompassing an entire year’s production and quality data.
- Continuous Monitoring:Regular monitoring ensures that processes remain capable, while APQR provides an annual overview, ensuring that any long-term trends are identified and addressed.
- Use statistical tools to analyse the collected data. For process capability, calculate Cp and Cpk regularly. For APQR, compile and analyze quality data at the end of the year.
- Action Plans:Based on the findings, develop and implement action plans to address any identified issues. Monitor the effectiveness of these actions through continuous process capability analysis and subsequent APQRs.
- Holistic Quality Management:Combining the detailed, real-time insights from process capability with the comprehensive, retrospective analysis of APQR leads to a more robust quality management system. This ensures both immediate and long-term quality assurance.
- Data-Driven Decisions:The data obtained from process capability can be used in APQR to provide a detailed analysis of process performance over time. This helps in making informed decisions regarding process improvements.
- Reporting:Document the findings from both process capability studies and APQR. Ensure that reports are detailed and provide actionable insights.
Conclusion
Process Capability and APQR (Annual Product Quality Review) is an essential measure and planning when focused on sustaining and enhancing the quality of the products in the pharmaceutical and biotechnology industries. Process capability gives an active picture of the performance of a specific manufacturing process, while an APQR offers an annual assessment of a product’s quality. When combined, these tools result in a comprehensive quality management system with oversight of quality requirements, manufacturing standards, as well as product quality and regulatory compliance with the ability to grow and adapt. Integrating the collective and systems approach will be feasible to attain better effectiveness within organizational performance and superiority within quality standards.


