
Efficiently managing processes is necessary for achieving business operational excellence. A cornerstone of this pursuit lies not only in adept quality management but also in the ability to comprehensively monitor and analyze the performance of manufacturing processes and product quality. This is where the Annual Product Quality Review Dashboard steps in—a potent tool that revolutionizes how organizations manage and optimize their operations. It provides invaluable insights into product quality, process efficiency, and regulatory compliance. The Role-based Dashboard gathers and presents important performance metrics, giving decision-makers the ability to spot trends, foresee issues, and push for ongoing improvements. In this exploration, we’ll delve into the unique features and benefits of the APQR Dashboard, uncovering its pivotal role in enhancing operational efficiency.
APQR Dashboard
APQR is a regulatory requirement imposed by bodies such as the Food and Drug Administration (FDA) for pharmaceutical companies. Nevertheless, the APQR Dashboard transcends the confines of the pharmaceutical sector. It serves as an expansive platform for evaluating for assessing performance across various domains, such as quality, delivery, and reliability, making it applicable across diverse industries.
Key Features and Benefits
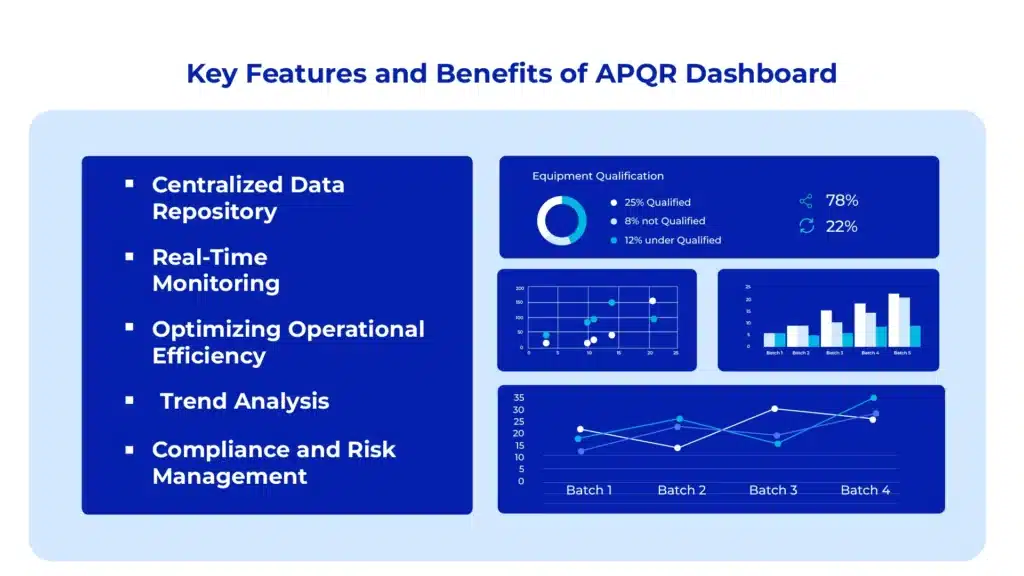
Centralized Data Repository
The APQR Dashboard functions as a centralized hub where all critical data related to product quality, manufacturing processes, and regulatory compliance is aggregated and organized into a single, easily accessible repository. This consolidation eliminates the need for manual sifting through various systems and spreadsheets, streamlining the data management process. By having all pertinent information readily available in one location, teams can save valuable time and resources and make informed decisions efficiently, leading to improved product quality, process optimization, and compliance with regulatory requirements.
Real-Time Monitoring
Dashboards allow you to benchmark, monitor, and improve performance by providing a comprehensive view of key performance indicators. Tailored to specific user roles, the APQR Dashboard, equipped with real-time data integration capabilities, provides instantaneous insights into raw material and process parameters, equipment utilization each pertinent to the responsibilities of different stakeholder.” For instance, Production Managers may focus on equipment performance metrics, while QA specialists monitor raw material quality and other indicators relevant to product quality. This means that stakeholders can access up-to-the-minute information, allowing for proactive decision-making and swift responses to emerging issues such as help identifying deviations early on, minimizing the risk of product quality issues or non-compliance.
Optimizing Operational Efficiency
Via performance monitoring with dashboard, encompassing metrics such as on-time report generation, report approval rates, rejection rates, equipment qualification, product quality indices, and compliance adherence, stakeholders can proactively address quality and compliance issues while optimizing operational efficiency. Moreover, the dashboard transforms the review process by presenting data in a user-friendly and visually appealing format. This enables stakeholders to set targets, monitor performance, and access relevant information quickly and efficiently to assist in informed decision-making.
Trend Analysis
The APQR Dashboard enables organizations to discern patterns and trends in both product quality and performance metrics. By identifying recurring trends and patterns, stakeholders can anticipate future challenges and opportunities, allowing for proactive measures to mitigate deviations and risks, and capitalize on strengths. Furthermore, organizations can fine-tune and optimize their current processes to uphold or elevate product quality standards while navigating changing market conditions with confidence and adaptability.
Compliance and Risk Management
By systematically documenting and maintaining comprehensive audit trails, organizations can demonstrate adherence to regulatory requirements and mitigate compliance risks. APQR dashboard’s robust risk management capabilities enable organizations to proactively identify and address potential risks, safeguarding against disruptions and ensuring continuity of operations.
Implementation Considerations
While the benefits of the APQR Dashboard are compelling, successful implementation requires careful consideration of several factors:
Data Integration
Achieving seamless integration with existing Enterprise Resource Planning (ERP) systems and other data sources is imperative for maintaining the accuracy and comprehensiveness of supplier data. By seamlessly connecting the APQR Dashboard with these systems, organizations can ensure that all relevant data is consistently updated and synchronized, thereby avoiding discrepancies and enhancing decision-making capabilities.
User Training and Adoption
Ensuring successful adoption of the APQR Dashboard requires more than just deploying the technology—it necessitates comprehensive user training and robust change management initiatives. Providing users with adequate training resources and support helps them understand the dashboard’s functionalities and benefits, empowering them to leverage its full potential in their daily workflows. Moreover, fostering a culture of change acceptance and user engagement is crucial for maximizing the utility of the dashboard across the organization and driving tangible business outcomes.
Continuous Improvement
Viewing the APQR Dashboard as a dynamic and evolving tool is essential for its long-term effectiveness. In today’s rapidly evolving business landscape, staying ahead requires continuous innovation and adaptation. Therefore, organizations must prioritize regular reviews and updates to the dashboard, ensuring that it remains aligned with evolving business needs and industry trends. By embracing a mindset of continuous improvement, organizations can harness the full potential of the annual product quality review Dashboard to drive sustained value and competitive advantage in their supply chain operations.
Conclusion
In an era marked by escalating intricacies and fierce competition, Annual Product Quality Review Dashboard stands out as a beacon of efficiency and insight in supply chain management. By equipping organizations with the tools to monitor, analyze, and collaborate with suppliers more effectively, it becomes a catalyst for operational excellence and a driver of sustainable business growth. Embracing the feature of attractive dashboards in APQR transcends mere strategy—it represents a transformative leap towards unlocking the boundless potential of the supply chain ecosystem, ushering in an era of innovation, agility, and unparalleled performance.


